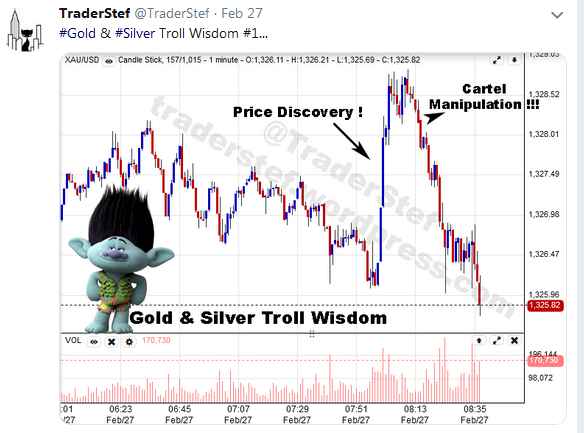
Price Derangement Syndrome (PDS) has returned to infect the discourse on gold’s price performance in earnest following a price pullback in late February, which prompted a crescendo of whining that culminated at the psychological breach of $1,300 on Mar. 1. The manipulation excuse is alive and well, and the trolls are busy and happily raiding their closets for straight jackets to pass along to anyone who will join their depression and scare you away from an asset class that provides the best insurance to retain your capital, bar-none.

It would serve a pained soul well to consider the overall condition of financial markets that investors and traders alike must deal with today. Precious metals are not alone on this road that’s littered with algorithms, artificial intelligence, and automated high-frequency bewilderment.
A Hedge Fund Big Beast Is Killed by the Robots… “While his models were still sophisticated, technology has changed everything… It’s the end of an era. The fabled but controversial hedge fund trader Philippe Jabre is hanging up his boots. His self-named firm is closing the three funds he personally managed, and that will be that.” – Bloomberg, Dec. 13
Stan Druckenmiller Says Algos Are Robbing Markets of Trade Signals… “Billionaire Stan Druckenmiller is glad he’s no longer in the hedge fund business now that algorithmic and quantitative trading have taken over markets. ‘I made 30% a year for 30 years. Now, we aren’t even in the same zip code, much less the same state.’” – Bloomberg, Dec. 18
Behind the Market Swoon: The Herd Behavior of Computerized Trading… “Behind the broad, swift market slide of 2018 is an underlying new reality: Roughly 85% of all trading is on autopilot – controlled by machines, models, or passive investing formulas, creating an unprecedented trading herd that moves in unison and is blazingly fast.” – WSJ, Dec. 25
“I’m On The Golf Course”: Nobody Has Any Clue How To Trade “Bewildering” Market… “Commenting on the market insanity observed in past week, Stephen Innes, head of trading for Asia Pacific at Oanda said it’s ‘completely bizarre…it’s incredible just how harmful markets veer when sentiment slides.’” – Zerohedge, Dec. 28
Investors Unaware Of Dangerous Change To Markets… “For investors who don’t watch markets every day, the notion that ‘volatility returned’ doesn’t begin to capture how dramatic price swings became. The Financial Times described one such interlude: ‘On December 24, US equity markets posted their biggest recorded crash for a Christmas Eve. But on Wednesday [the day after Christmas] they recorded their biggest rally for almost 10 years.’” – Real Investment Advice, Jan. 11
ICE To Implement “Flash Boys” HFT Speed Bump To Stop Gold, Silver Manipulation – Zerohedge, Feb. 13
When circumstances in life shift on a whim, you must adjust and move forward. As a participant in the fray of financial market serfdom, it would be wise to apply the same line of thinking with your invested capital, otherwise the overlords will eviscerate your will to survive at every breath and turn an asset may experience.
A father who served his country raised me, and his military mindset bled into many facets of family life, as well as wisdom regarding the focus of the mind. He would often say to me, “improvise, overcome, and adapt.”
Heartbreak Ridge – Clusterfuck Walking
“We’re paid to improvise, Sir, overcome and adapt.” – Clint Eastwood

Before moving on to today’s technical analysis, you can catch up by reviewing the most recent article at “Is Gold’s Surge to 5-Year Resistance a Breakout Launch or Joker Poker?” and the articles noted below.
- Gold – here’s why it just might be different this time – MoneyWeek, Feb. 21
- Data from the IMF on gold buyers in January 2019 – ForexLive, Feb. 21
- It’s Dumb To Have No Gold Amid All Of This?– ValueWalk, Feb. 24
- Bring Back Our Bullions: Romania May Too Seek to Pull U.K. Stash – Bloomberg, Feb. 28
Let us start today’s technical analysis by obliterating a fake news manipulation item that continues to pollute minds in the precious metal community. To view a larger version of any chart, right-click on it and choose your “view image” option.
Gold vs. S&P 500 Dec. 1996 to Dec. 2018…

The Great Financial Crisis was caused by an implosion of derivatives that resulted in several stimulus programs initiated by the U.S. Treasury Department and Federal Reserve in a bid to rescue the financial system from a precipitous global Mad Max scenario. Quantitative easing (QE) initiatives provided a parabolic shot in the arm for the price of gold following its Oct. 2009 breakout from a momentous 19-month Inverse Head ‘n Shoulders continuation pattern that launched gold to its all-time high in Sep. 2011.
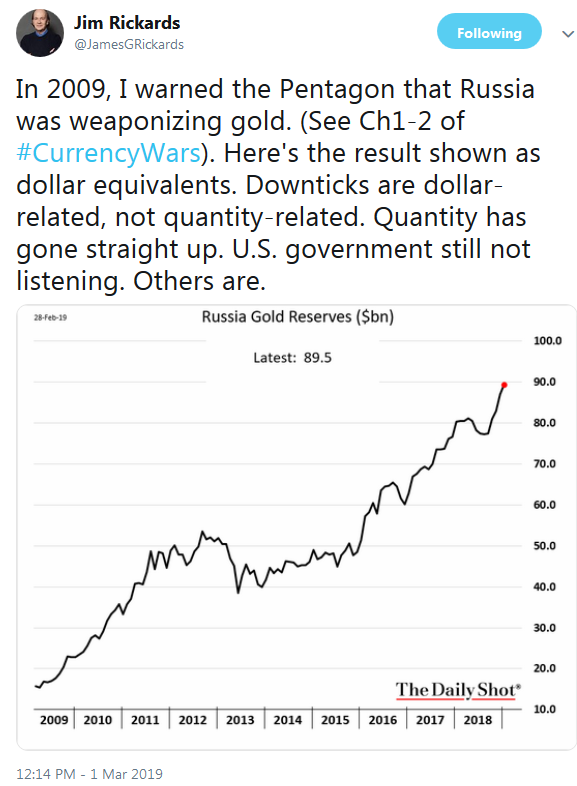
It is not a coincidence that during the same month in 2013, the S&P 500 broke away from a 7-year double top and 13-year overhead lateral, as gold plunged through the lower trendline of a bearish Descending Triangle. Smart money was primed to ride a stock market breakout with the Bernanke-put backstop guarantee, which washed away any fear in the financial markets that underpinned gold’s psychological appeal at the time, despite its solid fundamental argument as a safe haven from nefarious monetary policy. But remember, don’t do as they say, do as they do, because the central banks racked up their largest gold buying tally in nearly 50-years during 2018, and that accumulation began in 2010.
I will continue to post the following 20-year gold weekly chart until its significance sinks in to those who remain infected with PDS. The chart highlights the 50/200 Simple Moving Average (SMA) Golden Cross, which took place back in Dec. 2016.
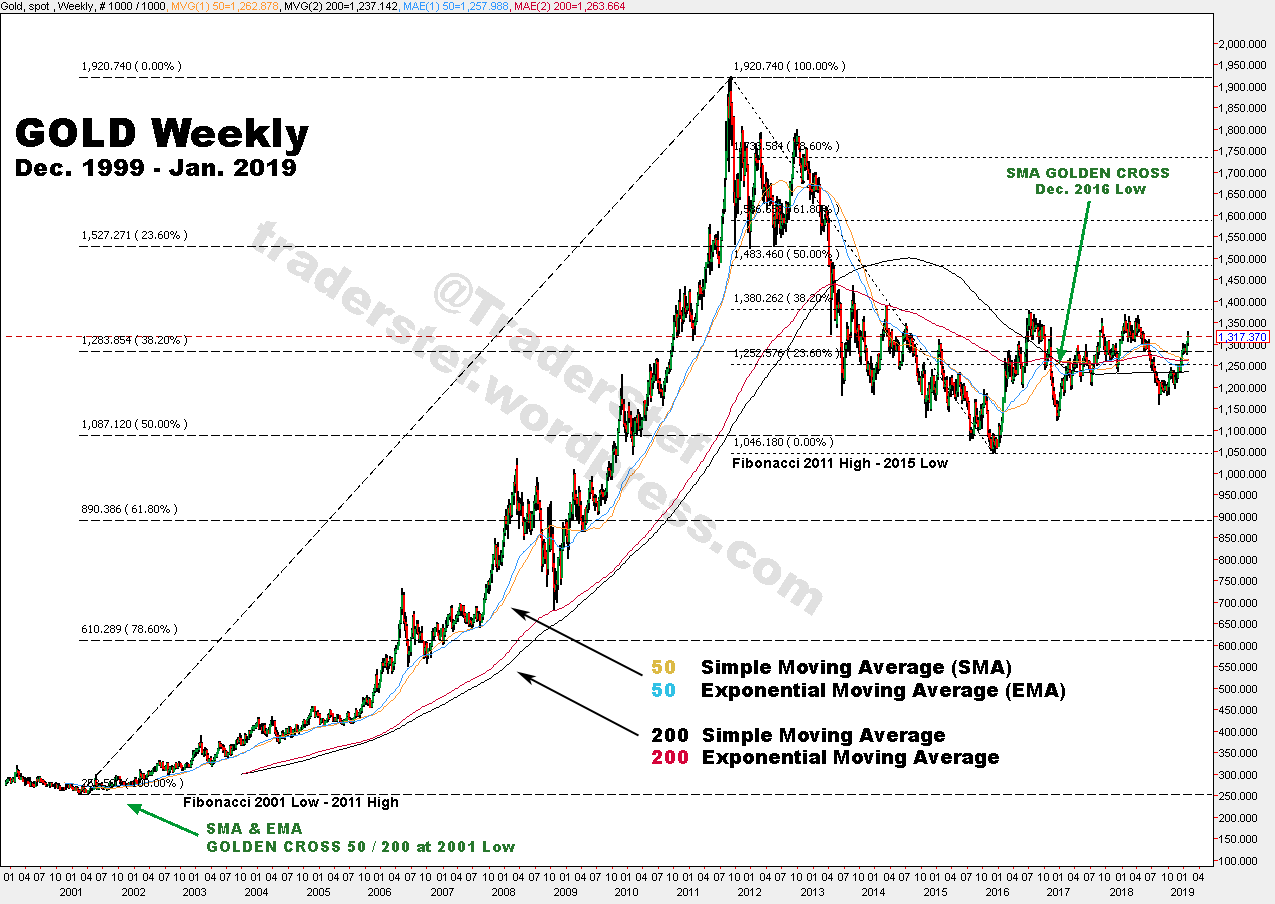
Excerpt from gold weekly chart analysis as of Feb. 7…
“I remain bullish near-term unless the lower trendline that marks the Ascending Scallop’s rise is decisively breached to the downside.” – TraderStef
Excerpt from the gold analyses as of Feb. 20…
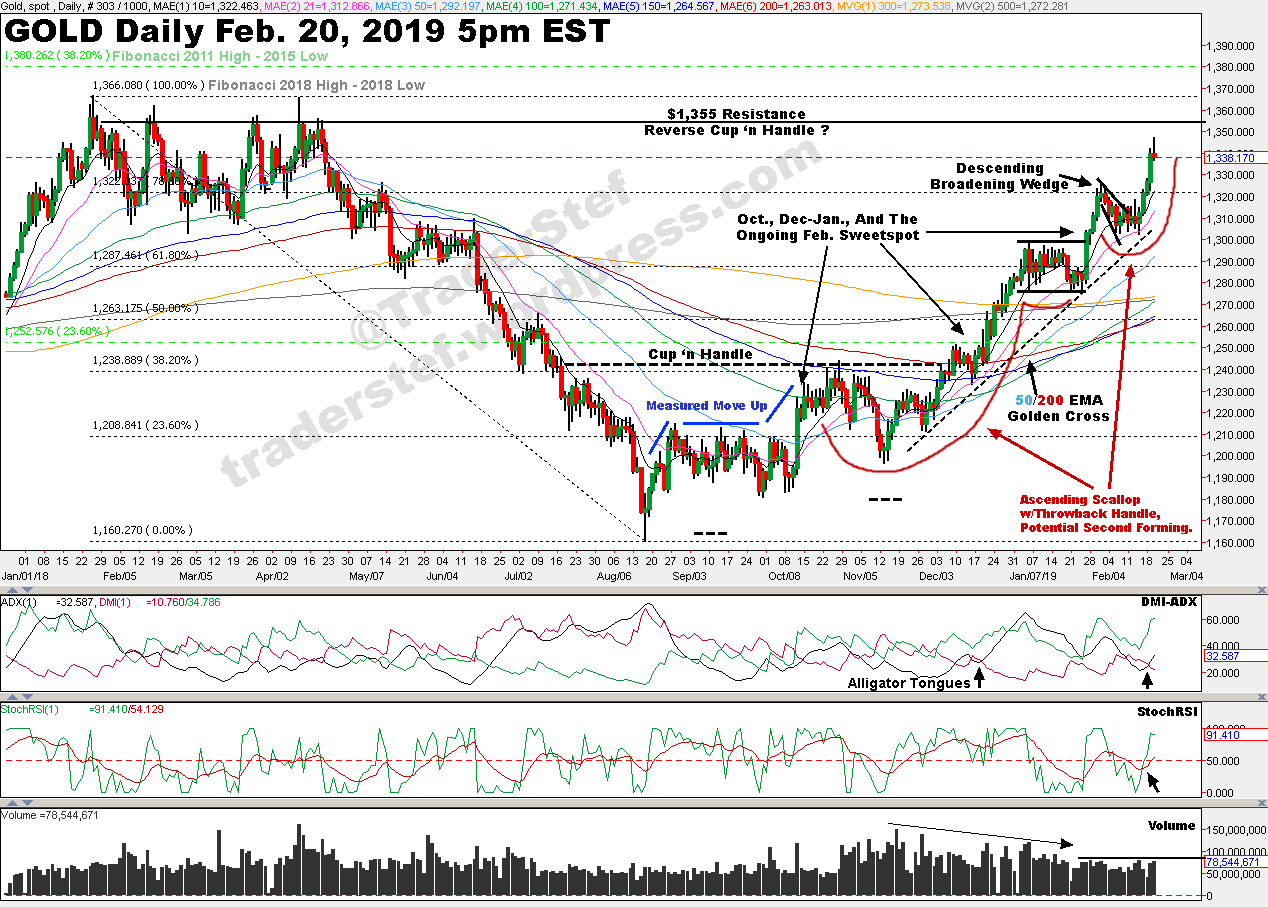
“I remain bullish near-term unless the 21 Exponential Moving Average (EMA) or lower trendline is violated, and even then, the 50 EMA is not far off and would likely provide good support. The current price action may be setting up for another Throwback pattern before attempting further gains. If the price reaches the $1,355 to $1,365 range, the combination of candlesticks and volume characteristics will determine if gold attempts a break beyond $1,380 before the usual seasonal dynamic takes hold.” – TraderStef
Gold Goes ‘Thunk’ and ’tis a Good Healthy Thing… “Gold’s 24-week parabolic Long trend just did, the nearly six-month ascent ranking third by duration since 2001. Price settled yesterday (Friday) at $1,295 for its worst weekly drop (-2.7%) since that ending Nov. 28, 2014 (-2.9%). ~~THUNK!~~ And ’tis a good thing… Absolutely right, Squire. Now pay attention. With Gold starting this past week still well up in the $1,330s, we began thinking that a correction in price would be healthy as nothing ascends upward in perpetuity. We ruminated that a nice pullback toward testing the mass of underlying technical support would provide enough tightened coil to then spring price back upward beyond the most recent high of $1,349 (20 February), once again giving Gold a shot at reaching Base Camp $1,377. ‘Tis our sense that such process now is underway: first this ‘thunk’ … consolidate … and then back up! Remember: a recapturing of $1,377 with a stabilizing of price ’round there, and then ’tis off toward our conservative forecast high (now for the second year running) at $1,434. That’s why this ‘thunk’ is a good thing. That said, the pretty picture of Gold’s weekly bars instead now sports its first red dot blemish since Sep, 7, 2018.” – Mark Mead Baillie, Mar. 2, 2019
Gold daily chart as of Mar. 1, 2019…
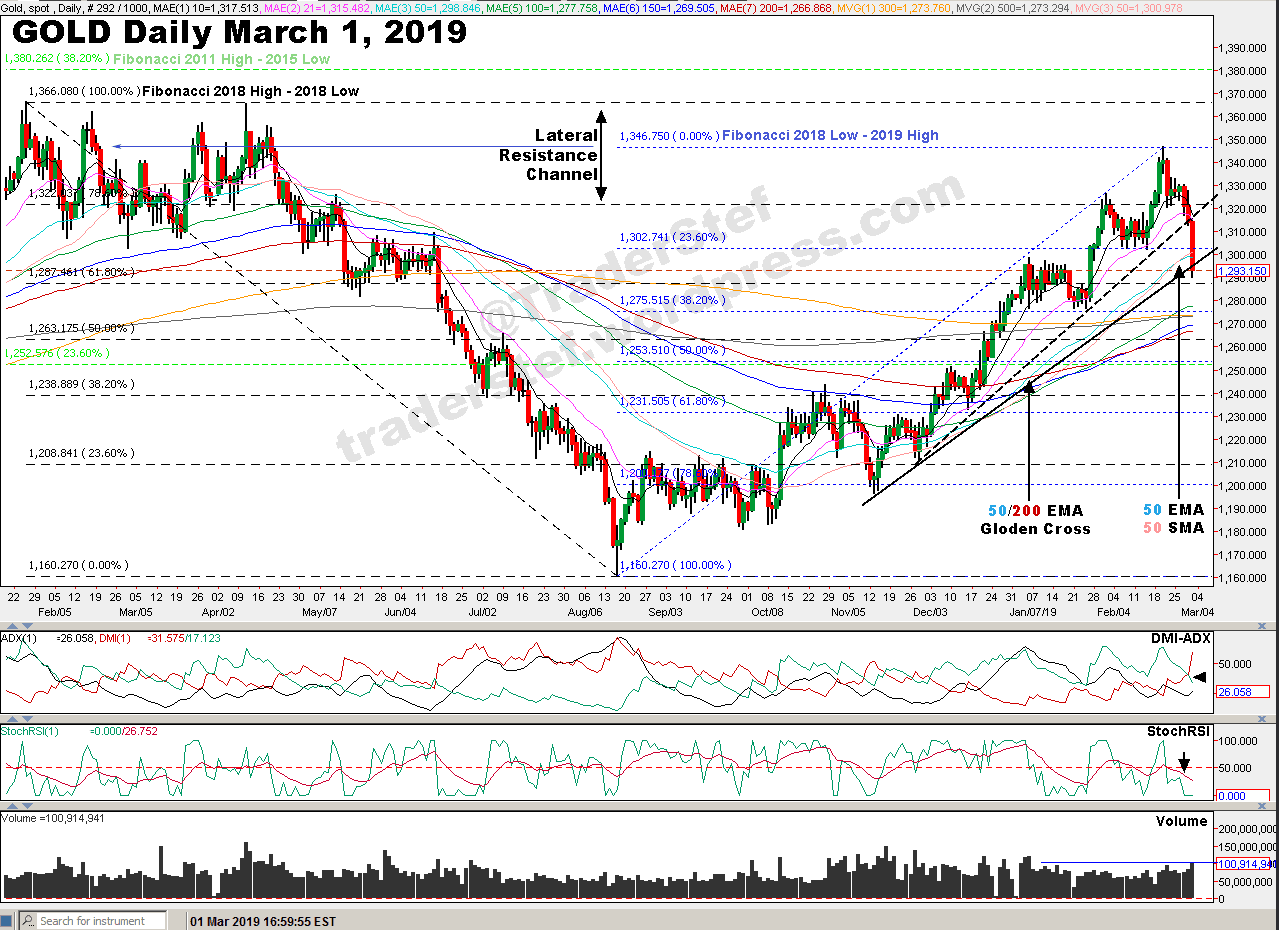
How do you improvise, overcome, and adapt to the insane poker hand this market feeds you? You paper trade the sweet spots and accumulate core physical positions at low-risk, high-reward intersections.
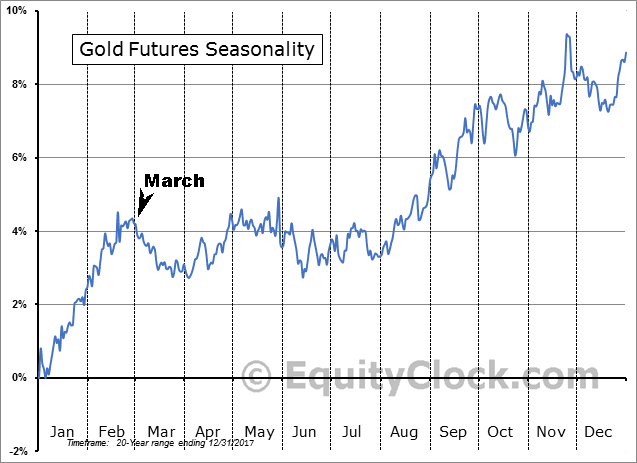
As suspected, following the stellar $200 upside run with three sweet spot opportunities to trade since Aug. 2018, a healthy correction is in the process of finding a base. The 21 EMA was breached to the downside on Feb. 28, and a lower trendline provided initial support. On Mar. 1, that trendline was breached as automated stop-loss positions were triggered and the price found support around the 50 EMA and SMA, a secondary lower trendline, and the $1,287 Fibonacci level that slices through the lateral price chop that occurred through Jan. 2019. The DMI-ADX has flipped to a negative stance, and the StochRSI plunged to an oversold condition on Mar. 1. The volumes were rising as the price fell during the last three trading sessions, and they have reached a peak or are fuel for further downside price action. The next support level is at the 100 EMA and $1,275 Fibonacci. The overhead 50 EMA must be taken out with conviction for an upside pivot to have any legs, otherwise the price will probe the next support level and/or chop sideways. March generally leans to the downside before chopping sideways when considering the seasonality pattern. I remain bullish long-term but revert to a neutral stance until the uptrend reasserts itself above the 50 EMA and $1,300 with conviction.
What the catalyst for gold to achieve an upside foothold will be is hard to say, as there are a lot of monetary policy issues, debt bombs, weaponized domestic politics on the front burner, and several geopolitical concerns to choose from.
Harley Quinn in Suicide Squad – Every Breath You Take
Plan Your Trade, Trade Your Plan
TraderStef on Twitter
Website: https://traderstef.wordpress.com