
Before addressing the gold and silver charts this evening, let’s take a look at why the mainstream press is reporting that it is more profitable to be unemployed in Joe Biden’s America than employed. A few hours before Biden gave a speech today, the Labor Department reported that hiring slowed dramatically in April. The nonfarm payrolls only increased by 266,000, with an unemployment rate at 6.1% vs. estimates for an increase of 1 to 2 million jobs and a 5.8% rate. The headline numbers were wretched, and the previous two months were revised down by 78,000 combined. The number of government jobs grew by 48,000.
According to the Bureau of Labor Statistics (BLS), there are 4.183 million workers who have been unemployed for more than 26 weeks, and does not include all the people that left the labor force.
Unemployed Over 26 Weeks 1969 to April 2021 – Calculated Risk

There is widespread reporting by CEOs and small businesses that they are having an extremely difficult time filling open positions. One reason behind the lack of applicants is Biden’s generous unemployment benefits and socialist utopia buried in the most recent 1.9 trillion American Rescue Plan. Many economists were expecting a higher jobs number amid signs that the economy was coming back to life as the pandemic ebbed across the U.S.
Shocking Jobs Miss Rips Up Traders’ Playbooks… “Spurring a rally in bonds and tech stocks as investors rethink the reopening. This was supposed to be a U.S. jobs report for the ages. One million more Americans were expected to be added to nonfarm payrolls — and perhaps even 2 million — in a sign that the world’s largest economy was breaking out of the Covid-19 pandemic… The immediate reaction in the $21.5 trillion U.S. Treasury market reflected reality. The benchmark 10-year yield tumbled more than 10 basis points to 1.464%, the lowest in more than two months. Bond traders rushed to push back expectations for when the Fed would start raising interest rates to June 2023.” – Bloomberg
A jobs report that covers one month and a couple of revisions does not necessarily implicate a trend, but it does solidify points I opined about last week in “The Inflation, Deflation, and Disinflation Rabbit Hole,” which turns the current inflation narrative upside down with the assistance of Lacy Hunt.
“When you have a large increase in the money supply and the Velocity of Money collapses to new all-time lows, the money supply is basically trapped in the financial markets… The U.S. is creating more and more debt that is not going to generate an income stream to repay principal and interest, and that continues to push the VoM lower. If interest rates rise beyond 2-3% on the 10-year Treasury, we’re in deep trouble.”
Biden and Yellen wasted no time this afternoon with filling the airwaves and mainstream headlines to drive home their points about the need for a massive $2 trillion-plus infrastructure bill they are prostituting as fiscal policy that will inevitably lead to even more financialization of the economy. Today’s nasty jobs report didn’t just spike the precious metals, as stock market indices rallied on an underlying message that the Fed and Capitol Hill will continue to throw monetary and fiscal frugality out the window. The only government agency that chimed in with a semblance of sobriety was the Chamber of Commerce.
Weak jobs report shows the need for massive jobs and families bills, Biden says… “President Joe Biden said April’s lower than expected job growth shows that his massive infrastructure and family support bills are needed now more than ever. The president rejected the idea that federal unemployment benefits are removing incentives for people to return to the labor force.” – CNBC
“U.S. CHAMBER OF COMMERCE: CALLS FOR ENDING $300 WEEKLY SUPPLEMENTAL FEDERAL UNEMPLOYMENT BENEFIT TO ADDRESS U.S. LABOR SHORTAGE.”
“YELLEN: WAGE GROWTH HAS NOT PICKED UP SIGNIFICANTLY – I DON’T THINK UNEMPLOYMENT BENEFITS ARE HURTING HIRING – I WOULD NOTE THAT THE JOBS REPORT IS A LITTLE BIT STRONGER THAN THE HEADLINE NUMBERS MIGHT SUGGEST – I BELIEVE WE WILL REACH FULL ECONOMIC EMPLOYMENT NEXT YEAR – I DOUBT WE ARE GOING TO SEE AN INFLATIONARY CYCLE – DEBT-LIMIT MEASURES COULD EXPIRE THIS SUMMER.”
Let’s move onto a brief overview of the gold and silver charts with references from “Gold and Silver Are Hedges for War – Technical Analysis,” published on Apr. 17. I’ll also include a link garden at the bottom of the page. To view a larger version of any chart, right-click on it and choose your “view image” option.

“Technically speaking, gold and silver are still not out of the woods despite a few rallies and positive signals since their consolidation pattern began in Aug. 2020.”- TraderStef
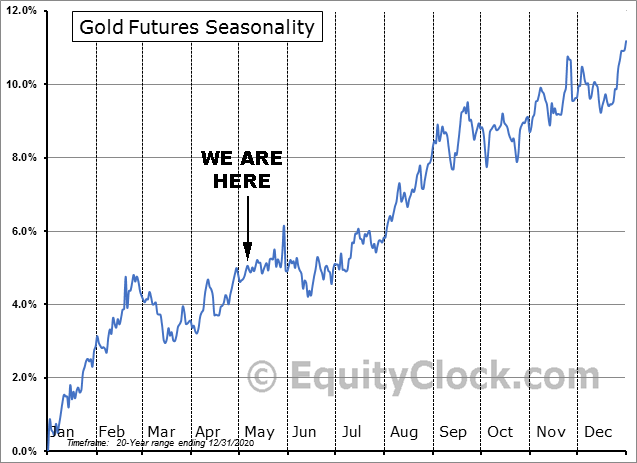
Gold’s 20-year seasonality pattern as of Dec. 31, 2020…
Gold Spot weekly chart as of May 7, 2021 5pm EDT close…

Excerpt from the Apr. 17, weekly chart analysis:
“If the low $1,780s at the 50 EMA is taken out with conviction and increased Volume, the next bus stop will be $1,820 in the near-term, then $1,860 at the Flag’s topside trendline. The price action has a lot of resistance to work through and is ripe for intraday scalps, with caution until $1,980 is breached.”
The Dragonfly Doji that completed an Adam & Adam Double Bottom continues to verify its relevance for the rally that began 5 weeks ago. It occurred at the confluence of a lower trendline drawn up from June 2019, a lateral support from the Inverse Head ‘n Shoulders drawn back to June 2020, the Half Staff Flag’s lower trendline drawn down from Aug. 2020, and confirmed a breakout from the Falling Wedge drawn down from the Jan. 2021 high.
Overhead resistance at the 50 Exponential Moving Average (EMA) lasted for 3 weeks until Apr. 15-16 and the subsequent throwback in price retested the 50 EMA as support from Apr. 28 to May 3. The rallies this past week were all fueled by falling dollar correlations, and the jobs report this morning was the icing on the cake that solidified Thursday’s break above $1,800. The price action printed a high of $1,843 before the European markets closed this morning and ended the week at $1,830 on top of a bullish Soldier Candlestick within an Up Channel.
The StochRSI is breaking to the upside and buy Volume is rising and solid, but the DMI-ADX is not yet set up for a power trend move. The topside trendline of the Half Staff Flag is the next battle at around $1,860, then a solid break above the $1,880 lateral will reopen a challenge of the $1,920 2011 high. The price action has less resistance to work through since last month and remains ripe for intraday scalps while working its way through to $1,980.
Silver Spot weekly chart as of May 7, 2021 5pm EDT close…

Excerpt from the Apr. 17, weekly chart analysis:
“The silver spot chart is more bullish than gold, as it has printed higher lows and remained above the 50 EMA since decisively breaking above the $21.49 Fibonacci level in Jul. 2020. Last week’s candlestick printed a breakout from the Falling Wedge drawn back to the Jan. 2021 high of $30… Silver is still ripe for intraday scalps, with caution until $29 is taken out on decisive buy Volume.”
After breaking away from the Falling Wedge, the price has printed higher lows within a steady Up Channel. The price closed at $27.43 this week and is sitting on the topside set of Fibonacci confluences. The price action has chopped in between those confluences since Aug. of 2020. The dominant pattern that is forming is a bullish Ascending Triangle with its topside trendline at $30.
The StochRSI is steadily making upward progress, the DMI-ADX is closer than gold’s to forming an Alligator Tongue power trend setup, and buy Volume is rising along with a rising price. The price action is edging closer to the all-important $29 to $30 resistance zone. If the $29-$30 level is taken out decisively on price and Volume, a bull run to $50 could be explosive. Stay on your toes.
$HUI Gold Bugs Index weekly chart as of May 7, 2021 close…

The $HUI is threatening to breakout from a Descending Broadening Wedge. The red vertical lines mark the beginning of summer seasonality in 2019 and 2020.
- What’s the Real Price of Gold? – Jim Rickards via The Daily Reckoning
- Poland’s central bank wants to buy at least 100 tons of gold – Reuters
- Gold Miners Record High Margins in 2020 – U.S. Global Investors
- Dollar’s Status as “Global Reserve Currency” at 25-Year Low – Wolf Street
- India’s March gold imports surge 471% to a record 160 tons – MoneyControl
- Tech is too expensive right now, buy value in miners – Bloomberg
- Connor Broadley Wealth Management prefers silver – CNBC
- China’s gold consumption has surged 93.9% YoY – Seabridge Gold
- German private households own over 9,000 tons of gold – Mining.com
- Demand for Gold is Expected to Grow Exponentially in 2021 – Goldcore
- Video: Silver Squeeze Retail Demand Will Break Paper Market – Keith Neumeyer
- Silver Investment Demand Explosion and Other Silver News – Peter Schiff
- Silver leads precious metals gains on dollar – Mining.com
Why Sam Zell Buys Gold for the First Time – Bloomberg, May 4 (click on image for video)


Plan Your Trade, Trade Your Plan
Website: TraderStef.com – @TraderStef on Twitter & Gab
Headline Collage Art by TraderStef
