An interesting week thus far for geopolitical issues, monetary policy, and domestic politics, and gold almost held firmly through all of it, until the trade war with China escalated this morning. Fascinating. Silver even managed to poke its head out well above $17, but the mindless algorithms ruined the party this morning. The unseen benefit is that big pockets were buying large, immediately after automated stop loses triggered weak hands to predictably bailout at several lower price points. More on that later.
First, we had the G7 Summit drama on trade and tariff issues up in the People’s Republic of Canuckistan (aka Canada), where the Prime Minister reportedly wears fake eyebrows. Second, Rocket Man and the POTUS finally had the much-anticipated face-to-face meeting on North Korea’s denuclearization, dubbed the “Singapore Summit.” Third, the FOMC forced another .25 piker in interest rates up the windpipes of the mainstream financial media punditry and decided that we must sit through a popcorn press conference after every meeting as of January 2019. Fourth, at the ECB, Draghi announced an end to the QE printing press beginning in early 2019, while keeping real interest rates in NIRP land where it remains in good company with the western peasantry. Fifth, the long-anticipated IG Report release exposed more stinking onion layers (unidentified FBI employee described Trump voters as “all poor to middle class, uneducated, lazy POS” the day after the 2016 presidential election) of the Deep State’s treasonous attempt to execute a soft coup against the duly-elected POTUS. Sixth, POTUS approved a 25% tariff on $50 billion worth of Chinese imports for not keeping the trade sandbox tidy, then China replied in kind this afternoon. Lastly, Bitcoin was pummeled back to the $6k level put in earlier this year, with more news of fraud and manipulation from a finance professor who is known for flagging suspicious activity at the casino we call markets.
There is plenty of news to digest in the precious metals department as well. Here is the latest and greatest.
IN GOLD WE TRUST REPORT 2018 – Gold and the Turning of the Monetary Tides. Download the report for free at Incrementum – In Gold We Trust, Jun. 2018

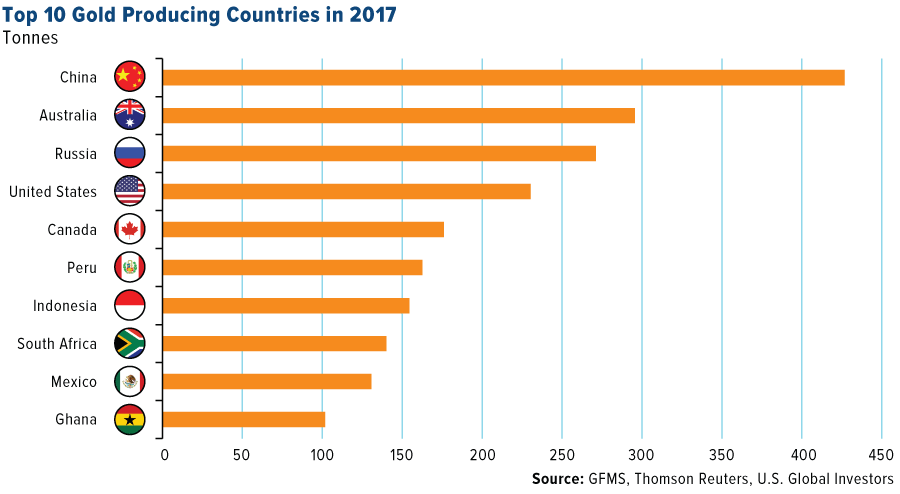
Russia to double gold extraction becoming world’s second biggest producer… “The country is currently third in the global rating of gold miners after Australia and China. However, that could change in less than a decade.” – RT, Jun. 3
Swaps, swapped: Switzerland’s AHV pension fund moves into physical gold… “The supervisory board has decided we are to invest in physical gold bars from now on.” – IPE, Jun. 5
The Gold Chronicles: June 2018 podcast w/@JamesGRickards and @alexstanczyk – Physical Gold Fund, Jun. 9
GATA asks bank regulator to check risks of gold futures maneuver… “GATA has appealed to the U.S. comptroller of the currency, who has regulatory authority over banks, to review financial risks certain banks may have incurred through derivatives in the monetary metals markets, particularly through the recent heavy use of the ‘Exchange for Physicals’ (EFP) mechanism of settling gold and silver futures contracts on the New York Commodities Exchange (NYMEX-COMEX). EFP settlements of futures contracts long were considered emergency procedures when a seller was not able to deliver metal from an exchange-approved warehouse and wanted to settle with delivery elsewhere. But now such settlements appear to constitute most gold and silver futures settlements on the NYMEX-COMEX. It is a strange development that appears to have been necessitated by the increasing difficulties of central banking’s gold and silver price suppression policy. GATA has received no acknowledgment of the letter. A PDF copy of it is here.” – GATA, Jun. 10
Craig Hemke at Sprott Money: EFP use for Comex gold is beyond belief … “The EFP mechanism has settled New York Commodities Exchange futures contract claims for more than 4,500 tonnes of gold. This is almost double annual world gold production and five times the metal held by the vaults in the London Bullion Market Association system. How is this even possible?” – GATA, Jun. 12
As GATA attempts to address the EFP issue over at the CRIMEX, I mean NYMEX-COMEX, transferring paper gold deliveries off the books over to Londonistan’s LME, consider China’s SGE gold withdrawal data vs. COMEX “delivered” as of 2017.

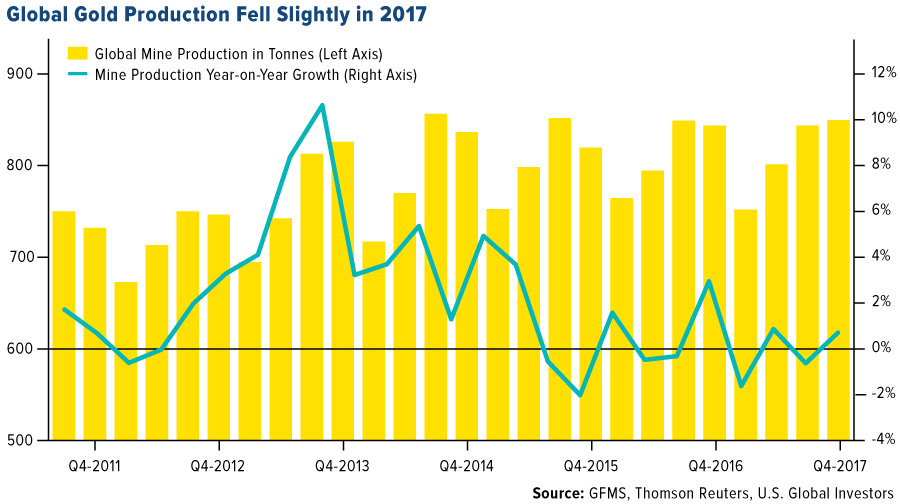
Top 10 Gold Producing Countries… “In 2017, global gold mine production was a reported 3,247 tonnes. This figure is down 5 tonnes from the previous year and marks the first annual drop since 2008, according to the GFMS Gold Survey 2018. The driving forces behind the drop in output were environmental concerns, crackdowns on illegal mining operations and rising costs. This raises the question I’ve explored recently – have we reached peak gold? The idea is that all the easy gold has already been discovered and explorers have to dig deeper to find economically viable deposits.” – Marketslant, Jun. 13
JPMorgan booked another 1.14MM ounces of silver into their Comex vault yesterday… “This takes their vault back up to 140,937,483 ounces and gives them a new high in their monopolistic control at 52.13% of the total Comex vault.” – TFMetals, Jun. 13
India’s silver use triples in a decade, world share up from 14.7% to 39.2% – Business Standard, Jun. 14
Multi-Billionaire Hugo Salinas Price – Trump May Shock The World By Putting U.S. Back On Gold Standard… “There is one way, and only one way, to do away with the Trade Deficit and renew the productivity of the U.S.: abandon the present International Monetary System (derived from the original Bretton Woods Agreements of 1944) and return to the gold standard.” – KWN, Jun. 14
On the monetary policy side of the equation, the great TaperCaper will eventually follow through to its precipice…
Fed is Rethinking Its Balance Sheet Unwind: Expect Lower LT Rates, Higher Gold… “Bloomberg has a significant story that matches my Fed balance sheet reduction hypothesis from the beginning. Please consider Fed’s Big Balance-Sheet Unwind Could Be Coming to an Early End.
If Cabana is correct, and I believe he is, there are at least four significant consequences. 1) Downward pressure on interest rates: If Fed officials do opt for a bigger balance sheet and decide to continue telling banks to prioritize cash over Treasuries, it may mean lower long-term interest rates, according to Seth Carpenter, the New York-based chief U.S. economist at UBS Securities. ‘If reserves are scarce right now, and if the Fed does stop unwinding its balance sheet, the market is going to react to that, a lot. Everyone anticipates a certain amount of extra Treasury supply coming to the market, and this would tell people, ‘Nope, it’s going to be less than you thought.” 2) Upward pressure on gold. 3) Downward pressure on the US dollar. 4) More free money to banks at taxpayer expense
Fed Rethink Hints: 1) The Fed increased interest it pays on excess reserves 20 basis points on Wednesday, rather than the expected 25 basis points. 2) The Fed significantly altered its FOMC statement about future policy. Moreover, the Fed has to be at least a bit worried about housing.” – Mish Shedlock, Jun. 14

The Fed has taken the first step toward an early exit from its balance sheet reduction… “Where once Fed officials believed the balance sheet would shrink from about $4.5 trillion to a range of $2.5 trillion to $3 trillion, the required level may be considerably higher, depending on how much in reserves the banking system will need to remain liquid. Reducing the bond holdings results in a decrease in reserves. No central bank in the world has ever attempted a balance sheet reduction on this scale, so the skill to which the Fed can pull it off is critical. As the Fed has been continuing the program, financial markets have tightened and may require a quicker exit from the program than officials had figured. Markets had been anticipating that the program would run for several more years, but Wall Street pros are now considering a much sooner end.” – CNBC, Jun. 14
Fed Is “Living Dangerously” – The Great Financial Crisis “Will Be Eclipsed” – Alasdair Macleod, Jun. 14

The mining sector felt the heat from today’s trade war headlines…
Trump trade war blows up big week for mining majors… “Mining and metals investors were offloading the sector’s big names on Friday over fears of the impact of a trade war between the US and China, which is responsible for nearly half the world’s industrial metal demand and two-thirds of the world’s seaborne trade in steelmaking raw materials.” – Junior Mining News, Jun. 15
On to the gold charts. As the world turns upside down before your eyes, do not forget that the next seasonal upside for the gold price is upon us. To view a larger version of any chart, right-click on it and choose your “view image” option.
Gold spot seasonal 30-year average as of June 2018…

Gold futures seasonal 20-year average…

Here is the most recent Commitments of Traders (COT) report (published today, but data is for Jun. 12 close) for gold, overlaid with the weekly gold price chart as of today’s 5pm close. Note the COT net positions pattern of highs and lows, and total Open Interest (OI is the fine green line, with lows marked by arrows at the base) vs. the gold price candlesticks. The correction is near its end, and today’s price action could be a final capitulation if near-term news flow is gold price friendly.

Gold spot 1-minute chart as today’s price fall was approaching its end…

Coincidentally, news headlines that POTUS imposed tariffs on China occurred just prior to the CRIMEX open. The Euro also got hammered this morning due to an ECB-Draghi residual selling wave, which resulted in a USD surge. Believe as you wish, but the price action in gold this morning, tick-by-tick, candle-by-candle, patterns, volume prints, and USD etc., did not print a cartel mini-puke manipulation or spoofing scheme. The price move spanned nearly three hours. I call it automated algorithmic selling mayhem, triggered by multiple weak handed players that have programmed sell stops in place. The orgy fed upon itself as each support level triggered, and was more orderly than a mini-puke or flash crash situation. Buying outweighed the sells many times, as BTFD heavyweights scooped up yuge positions at several points along the way. Three stood out like sore thumbs, and were exactly forty-five minutes apart. Always amazing to watch, but also disappointing to read the usual manipulation mantra on the social feed or blogosphere. With that said, yes, there is a form of manipulation taking place, but instead the result of mindless automated algorithms trading on the exchanges that dominate the modern casino. This market is not a supply and demand delivery operation in the near-term like your neighborhood lemonade stand. Shit happens, and just because a large buying volume footprint takes place, does not immediately translate into a higher price. I suspect that large buyers were not all automated either. There were real human decision makers observing the tape, and they took advantage of the chance to cover stale shorts if they had any, and go long, or simply add longs after patiently waiting for any opportunity to do so before the usual seasonal price pattern kicks in. I am also not naïve, and realize there were a few algorithms playing around that were not upward price friendly. Overall, it was a sell-off triggered by trade war news that coincided with the U.S. pre-market players, with all sides of the trading sandbox tossing globs of sand around while taking advantage of the situation in their favor. That in itself does not translate into a plan executed by the cartel.
Noted twice in my technical analysis from May 28 …
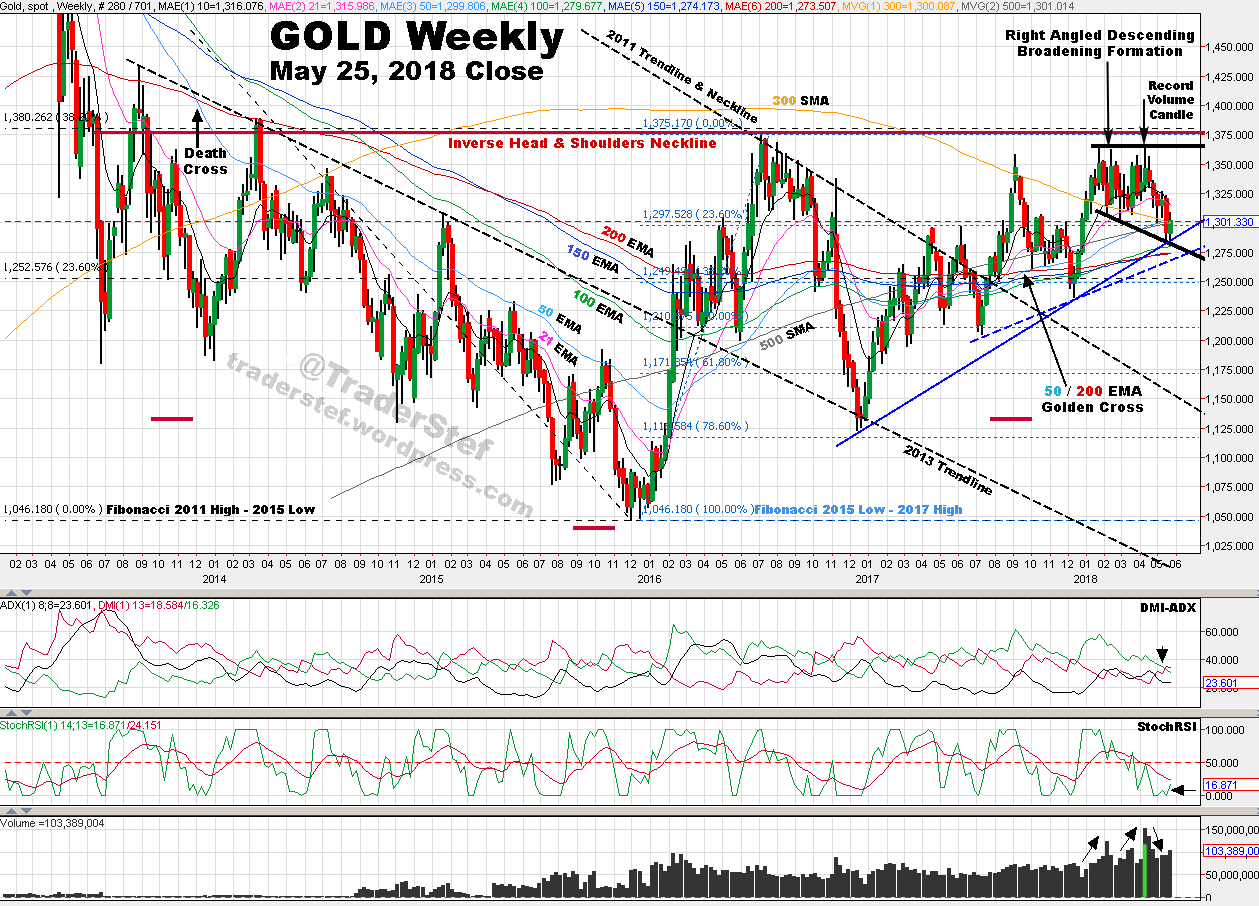
“…I will revert to a neutral near-term stance, with a caveat that this temporary weakness in price has provided an opportunity to consider low-risk entry points if laddering core positions or scalping high-volume price spikes up to the $1,380 resistance area…. The chart remains Bullish long-term and Neutral near-term, with an opportunity to ladder additional core positions…”
Gold spot weekly chart as of the May 25, 2018 close. Visit the May 28 article if you want to read the full written analysis that goes with this chart.
Gold spot weekly chart as of the Jun. 15, 2018 close…

For brevity and to focus on data that is most important, this weeks chart is not as detailed and zoomed in a bit vs. the May technical analysis. There has not been serious technical damage, but is now much closer to doing so.
The price action was large to the downside today and closed at $1,279.37, and is only $2.64 lower than the previous low of $1,282.01. Today’s low at $1,275.39 printed during the 1:30pm COMEX close. The Right-Angled Descending Broadening Formation remains intact and its lower trendline was tapped today. It is preferable not to go much lower from here because the pattern will be negated, as well as breaking below several important supports. Price is currently sitting on a confluence of the 100, 150, and 200 EMA, and the lower trendline drawn up from the two most recent lows in 2017. If price pivots off the current level, or even the next Fibonacci around $1,250, all is good. Anything below that with conviction could precipitate a drop to the $1,210 level. The positives are the confluence of support mentioned above, the Golden Cross remaining in-play, falling volume for the overall correction with the exception of one bump up as price chopped sideways, and the StochRSI is getting long in the tooth by bouncing around as low as it can go. What I do not like is the 50 EMA being $20 above the closing price, and the DMI-ADX attempting an Alligator Tongue set-up to the negative.
The chart remains Bullish long-term and Neutral near-term, with opportunities to ladder additional core positions, as well as scalp any price spikes with volume. $1,380 is the number and now requires a $100 trip.
Plan Your Trade, Trade Your Plan
TraderStef on Twitter
Website: https://traderstef.wordpress.com