
The manipulation meme is back in fashion and it dragged along the most die-hard precious metals folks who fell into the rabbit hole with emotional breakdowns on social media. I will refrain from offering counseling services. Although, I will repeat to anyone with blinders on that have had enough of fund-a-mental-cases and conspiratorium nonsense and want to get real.
Peter TooGood: Markets have “nothing to do with fundamentals anymore” – CNBC, Dec. 2019
What you witnessed on the charts this week was the result of high-frequency (HFT) trading platforms, algorithms, and artificial intelligence (AI) interacting within a complex and automated global financial network. The biggest trading firms across the world have spent billions and a couple of decades to build ultrafast systems, such as microwave networks and direct fiber connections to exchanges’ data centers.
“The market does not know you exist. You can do nothing to influence it. You can only control your behavior.” – Alexander Elder
“I still expect 10yr to 1.20% though could see 1.60% first. My entire forecast remains unchanged. This is typical Algo misread & overreaction.” – David Hunter, Jun. 17
“What worked yesterday, may not work tomorrow. What the market cared about last week, it may not care about next. Recognize when things make sense to you & capitalize. When things don’t, step back. That simplicity can be the difference in having a short trading career vs longevity.” – Anthony Crudele, Jun. 19
News headlines generated by presstitutes and the financial press that immediately followed the FOMC announcement on Wednesday were largely responsible for misrepresenting what the Fed actually communicated.
The Inflation, Deflation, and Disinflation Rabbit Hole… “There is a hot debate in the financial universe about the risk of runaway inflation as gold remains a stable store of value.” – TraderStef, Apr. 30
The machines took the taper bait after reading legacy media headlines that were duplicated on social media platforms, then exhausted numerous technical support areas on the charts that were filled with automated stops that cascaded across several time zones. Imaginary speed bumps will not save you in this global matrix that’s littered with a mindless-millisecond hell. The Fed is already mopping up this weeks swoon in the markets with damage control on Friday.
Exclusive: Fed’s Kashkari opposed to rate hikes at least through 2023… “Minneapolis Federal Reserve President Neel Kashkari said on Friday he wants to keep the U.S. central bank’s benchmark short-term interest rate near zero at least through the end of 2023 to allow the labor market to return to its pre-pandemic strength… With employment still short of its pre-pandemic level by at least 7 million jobs, he said, ‘the labor market is still in a deep hole,’ adding that he believes full employment means a return to at least pre-pandemic labor market strength, if not beyond.” – Reuters, Jun. 18
I am old enough to remember when precious metal pundits actually believed that converting the London “fix” to an electronic bidding system would create a miracle. I also remember when “open cry” trading pits were the norm and investors knew that futures markets are a hedge and not a delivery mechanism (1993 CBOT Video).
CME Group to Close Most of Its Chicago Trading Pits Permanently… “The exchange operator CME Group Inc. said it would permanently close most of its open-outcry trading pits in Chicago, ending one of the world’s last vestiges of old-fashioned floor trading… In 2016, CME shut down the Manhattan energy trading floor of the New York Mercantile Exchange, one of its subsidiaries. The next year, CME ended a daily auction on its Chicago trading floor that had helped set the national price of cheese, replacing it with an electronic process.” – MarketScreener, May 4
Market veterans mourn slow death of historic trading pits… “Over the past few decades (mostly since 1999), trading has overwhelmingly shifted into the world of algorithms. Today, even the New York Stock Exchange is largely a TV studio, with most of the actual trading taking place at its data centre in New Jersey… Covid-19 has killed off some of the last bastions of “open outcry” trading pits. NYSE Arca Options in San Francisco, and the Eurodollar Options, Box Options, and VIX Volatility Index in Chicago… The chief executive of the London Metals Exchange (LME) known as “the Ring,” said he hoped a hybrid approach would extend its longevity.” – FT, Jun. 11

Before moving on to the latest narrative about Basel III or diving into gold and silver charts, please take the time to review an interview and a series of articles I penned in 2019 about “price derangement syndrome.”
Fake News in Gold w/TraderStef on Operation Freedom – Live w/Dr. Dave Janda Mar. 2019
Price Derangement Syndrome Fuels Gold Pundit Insanity Part 4… “As described at the opening of Part 1, 2, and 3, which followed a tremendous $200 rally in gold, with three sweet spot trading opportunities identified, price derangement syndrome (PDS) returned to infect the discourse on gold’s price performance after a pullback in late February prompted a crescendo of whining that culminated at the psychological breach of $1,300. Fortunately, the whining has abated to some degree, but less than accurate speculation about manipulation occurs at every price wiggle, with gremlins forever hiding behind every candlestick on a gold or silver chart.” – Apr. 2019
The GLD is Merely a Passage With No Manipulative Influence on the Gold Price… “The GLD price does not determine the price of gold, nor do fluctuations in the physical gold held by GLD determine the OTC market price. The price originator for the GLD price-setting mechanism is the OTC spot gold market. GLD is also a lagging indicator.” – May 2019
Gold’s Alligator Tongue and Asian Short Squeeze Obliterated $1,380 Resistance… “The Fibonacci resistance level at $1,380 is now history after 5 years… Today’s daily chart visual speaks for itself. It has been quite a run and I hope my analysis has helped with your investing and trading goals. For the record, nobody cares about silver until it breaches $21.50 with conviction.” – Jun. 2019
Monkey Hammered Muppets… “Just like the global warming cultists that converted to a “climate change” catchphrase after facts caught up with the conspirators and chiefs, the troll farm and “blame anything but the obvious” crowd that existed well before Greta’s “how dare you” meme, has adopted that brand of hysteria after a DOJ spoofing indictment for gambling within the institutionalized digital spaghetti. The wired angel hair of modern automated trading platforms that regurgitate algorithmic mayhem laden with machine learning AI, HFT, and dark pools took root and matured a decade before the SEC or DOJ had an epiphany to finally grow a pair and recognize the weather patterns of modern trading technology.” – Oct. 2019
A.I.-Hammered Muppets… “Automated trading technologies have enabled the machines to read and machine-learn breaking news headlines, which result in the instantaneous execution of block trading. The effect is obvious to a seasoned trader that views real-time price action on a chart.” – Nov. 2019
Silver and Gold in 2020… “I have never stepped into the ring with a price prediction for an upcoming year, but this year seems different no matter how you slice and dice the domestic, geopolitical, and monetary policy variables at play… There is room for a surprise gain to approach gold’s all-time high or better… The catalysts for a rise in price are the continuation of low savings yields, negative interest rates, a bubbly stock market, very accommodative monetary policy by central banks, precarious domestic politics and geopolitical risks, and a continuation of safe haven accumulation of gold by the wealthy and central banks.” – Dec. 2019
Lately, there is regurgitated chatter making the rounds about the Basel III regulatory framework this month. That framework was hammered out in 2010 after the Great Financial Crisis and has been intermittently implemented over the last decade with several years to go. The current stage will likely have no impact on gold because the central banks already began hoarding gold at a record pace in 2009/10 when they participated in developing the draft.
Basel III: A global regulatory framework for more resilient banks and banking systems… “The objective of the reforms is to improve the banking sector’s ability to absorb shocks arising from financial and economic stress, whatever the source, thus reducing the risk of spillover from the financial sector to the real economy. This document sets out the rules text and timelines to implement the Basel III framework.” – Bank of International Settlements (BIS), Dec. 2010
Excerpt from Price Derangement Syndrome Part 4:
“The bottom line is that gold is now considered a Tier 1 asset instead of Tier 3 on banks’ balance sheets. As a Tier 3 asset, gold was only valued at 50% of its market price. The Tier 1 qualification makes gold a loan-backing reserve at 100% of its market price, which is the same as cash and sovereign bonds. For the first time in a half-century, gold returned to its status as money in the financial system. The speculation is that central banks will start buying gold and its price will rise exponentially. The truth is that the BIS gave the banks nearly a decade to comply with Basel III, which just happens to be the same time slot that central banks backed up the truck and began hoarding those pet rocks. As the price of gold chopped sideways since 2013 and printed a low of $1,046 in Dec. 2015, the central banks were buying hand over fist on the cheap. That does not mean they will not buy more or the price will remain stagnant, but they already took a large chunk off the market at bargain basement prices that were hovering around the mining cost of production, all the while some folks were busy whining about the price action and hunting cartel ghost activity that is legal Teflon.” – Apr. 2019
The “In Gold We Trust” team noted the buildup of gold reserves in their latest report.
Central banks have become a reliable factor on the demand side since the Great Financial Crisis of 2008/2009… “This shift may indicate a reassessment of gold’s role amid ongoing financial and economic uncertainty and reflect long-term concerns about fiscal sustainability. However, increasing emancipation from the US dollar, owed in part to US monetary and economic policy reprisals, is also likely a motivator for the continued buildup of gold reserves. Today, reported official gold reserves are only 9% below the all-time high of 38,491 tonnes in 1966.” – In Gold We Trust Report, May 27, 2021

Central Banks’ Gold Holdings – Chart Courtesy of World Gold Council (WGC)

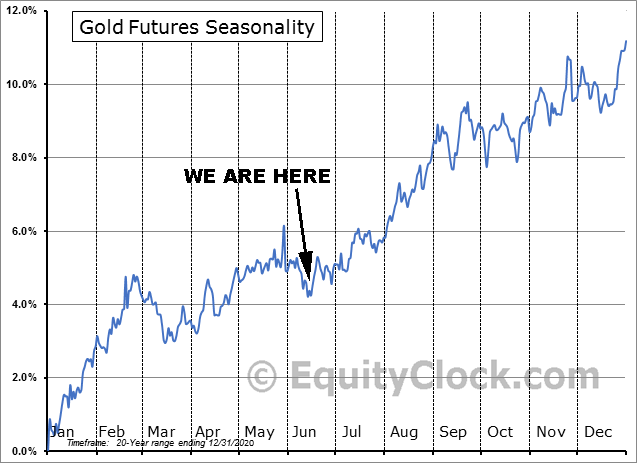
Let’s move on to the gold and silver charts. First, an update on where we stand on seasonality price patterns.


To view a larger version of any chart below, right-click on it and choose your “view image” option.
Here are the gold and silver futures overlayed with the Commitments of Traders (CoT) report for the last decade as of Jun. 18, 2021. Note there is no significant shift in the net long vs. net short positions prior to Wednesday’s FOMC meeting. The charts are courtesy of Timing Charts and my annotations.
Gold…

Silver…

$DXY Spot USD daily chart as of Jun. 18, 2021 close…

A spike in the dollar was the primary cause for gold and silver’s downside price action. The bond market didn’t buy what the algorithms were selling because the 10-year Treasury note yield closed lower on Friday than it opened at on Monday.
Gold Spot daily chart as of Jun. 18, 2021 close…

Excerpt from the May 31 daily chart analysis:
“The price action is bullish, but it does appear that a healthy breather is in order near the $1,920 lateral and Fibonacci confluence. The Alligator Tongue power trend set up on the DMI-ADX is slightly long in the tooth along with the StochRSI, which are another indication that a healthy breather may be in order before challenging $1,960, the more important $1,980, and finally $2,015.”
There is technical damage on the chart due the rapid $150 downside this past week, and we can thank the FOMC news event and automated mayhem for the much larger than expected breather and throwback. The Swiss Stair pattern from May’s Double Bottom to the Half Staff Flag’s breakout contributed to the price swoon because institutionals with big pockets were accumulating positions and any stops triggered the unloading of large blocks. This is not the first time we’ve seen the price rise or rollover on a news driven event after a substantial trend needed a healthy pause. I repeatedly cautioned everyone to wait for the $1,980 resistance level to be decisively taken out before making a large capital commitment this summer.
I’ve added another set of Fibonacci levels that are drawn from the Double Bottom and up to the recent high just below $1,920. The price action paused at the 61.8% retrace level around $1,765 on top of a capitulation zone. That zone includes lateral support within the Double Bottom and at the price consolidation from early summer 2020 before the bull run to $2,075.
The most important indicator I am keeping an eye on is the 50/200 EMA Golden Cross. Despite the fall in price, it is important that it did not reverse. The same dynamic took place in late 2018 and early 2019 before the $1,380 resistance level of 5 years was obliterated in the summer of 2019. Also note that the StochRSI is deep into oversold territory and the DMI-ADX is showing its first sign of approaching oversold status after the abrupt reversal from a bullish setup.
Trade with caution until a sustained reversal and bullish pattern appears.
Silver Spot daily chart as of Jun. 18, 2021 close…

Excerpt from the May 31 daily chart analysis:
“The silver daily chart is constructive and the price action is trending above all the moving averages. The Ascending Triangle continues to build… The $28 lateral resistance has been a challenge for a week as the DMI-ADX and StochRSI slowly reset to resume a positive trend. As noted on numerous occasions, the $29 and $30 resistance levels are a big deal. The longer silver consolidates here and follows gold’s lead, the more likely a breach above $30 will happen sooner than later. The silver chart is bullish and a breather with gold would be healthy. Beyond that, there is a potential for a really hot summer with blistering upside moves.”
Despite the near-term Half Staff Flag turning into a bust, the silver chart fared much better than gold and a bullish Ascending Triangle remains in play. There is technical damage, but all of the Exponential Moving Averages were not violated and there is a decent size gap between the current price and the Ascending Triangle’s lower trendline. Note that the downside candlesticks remain within the Fibonacci levels of confluence. The StochRSI is not as oversold as gold and the DMI-ADX did not flip as quickly to a negative trend. It appears that silver may recover sooner than gold if they fail to tightly correlate for any reason this summer.
I hope my repeated calls to wait for $29 and $30 were taken to heart before committing large amounts of capital. The events this week are an example of why I provide a conservative outlook with resistance levels in my analyses. Trade with caution until a sustained reversal is evident.
My final thought is that fundamentals eventually win in the end, but how much pain are you willing to endure in the process if you don’t adapt, overcome, and improvise your investment strategy with technical indicators that algos feed upon. The paper sandbox is difficult to play in, but the physical bullion side of the playground is wrought with supply issues and there are hefty premiums to be paid IF you can find what your’re looking for.
Retail level premiums as of June 20, 2021:
- 1oz Proof American Eagle Gold Coin $2,750, Gold Spot $1,765
- 1oz Bright Uncirculated American Eagle Silver Coin $45, Silver Spot $26
Heartbreak Ridge – Clusterfuck Walking
“We’re paid to improvise, Sir, overcome and adapt.” – Clint Eastwood
Plan Your Trade, Trade Your Plan
Website: TraderStef.com – @TraderStef on Twitter & Gab
Headline Collage Art by TraderStef
