As described at the opening of Part 1, Price Derangement Syndrome (PDS) has returned to infect the discourse on gold’s price performance in earnest following a price pullback in late February, which prompted a crescendo of whining that culminated at the psychological breach of $1,300 on Mar. 1. The manipulation meme magnetically attracts topics that I expect after having come across a majority of them for 20 years. When they involve legitimate concerns based on numerical facts, such as the futures contract paper playpen at the COMEX and how it is utilized by large players, such as China, I am all ears, and I get it. As for the rest, which include escapades such as spoofing plebes, at least a few analysts in the precious metal sphere have the courage to include a disclaimer to ensure plausible deniability after racking up extra-large clickbait that pollutes the mind of retail-level folks.
I came across the following quote after traveling three clicks deep through two different articles, only to arrive at the original source published a week ago. The article pontificates that the BIS manipulates the GLD ETF with a mysterious bullion drawdown via swaps manure, in turn causing the price of gold to rollover in late February.
“Do you recall that we discussed a couple of months ago whether the source of (paper) gold swapped with the BIS was ETF gold where the bullion banks acted as custodian? There is nothing in the BIS reporting that I have found which would confirm that this is the case, but it seems highly plausible to me… Again, though, in the deliberately opaque global gold “market”, very few things can ever be stated with absolute certainty. All we can do is sift through the rubbish of the IMF-BIS-CB dumpster, looking for clues that reveal their nefarious plots against gold and sound money, in general.”
First, if you visit the GLD SPDR Gold Shares prospectus and fact sheet, you will find the following:
“Objective: The investment objective of the Trust is for SPDR® Gold Shares (GLD®) to reflect the performance of the price of gold bullion, less the Trust’s expenses. The Price of Gold: The spot price for gold bullion is determined by market forces in the 24-hour global over-the-counter (OTC) market for gold. The OTC market accounts for most global gold trading, and prices quoted reflect the information available to the market at any given time. The price, holdings, and net asset value of the Gold Shares, as well as market data for the overall gold bullion market, can be tracked daily at www.spdrgoldshares.com.”
GLD is a derivative that trades only a few hours per day vs. the 24/7 OTC market that is available through various platforms, such as FOREX (currency trading) via Netdania. In case you missed it, movements in the value of currencies inadvertently affect the price of gold. The GLD price and mechanism behind its price discovery do not determine the price of gold, nor does the physical gold held by GLD determine the OTC market price. The price originator for any quote setting mechanism is the over-the-counter (OTC) spot gold price. Participants and quote providers include market makers (aka dealers) that are international banks, the clearing/bullion banks associated with the LBMA, and brokers such as ICAP. Those agents operate in the main physical gold trading centers of London, Zurich, New York, and Asia. The end-client base of the dealers and brokers include a majority of central banks that hold gold in their vaults, private investors, mining companies, producers, refiners, and fabricators. The dealers also take positions in their own accounts.
The OTC spot gold price is quoted as one troy ounce. Due to the OTC market nature, there is no last done price because quotes originate from a variety of sources. Despite multiple sourcing, only small discrepancies exist among quote providers due to competition for best bids and offers, and dealers and brokers minimize differences through arbitrage. The twice-daily ICE benchmark price quotes out of London serve as a convergence of many sources from OTC spot gold.
If you would like to read a good explanation in non-technical language of how the GLD and SLV function, an article appeared in Mar. 2015 and was republished across the precious metal sphere. Simply replace SLV with GLD in the following excerpt:
“When stock traders buy SLV shares faster than silver itself is being bought, the SLV price threatens to decouple to the upside. To prevent it from failing to mirror the metal, SLV custodians have to shunt this excess demand into silver itself. So they issue enough new SLV shares to meet demand and keep the SLV price in line with silver’s, and then they plow all this new cash raised directly into physical silver bullion. Conversely, when stock traders dump SLV shares faster than silver is sold, the SLV price will soon break to the downside. This differential selling has to be funneled into silver itself. SLV custodians do this by buying back enough SLV shares to sop up their excess supply. They raise the funds necessary to do this by selling some of SLV silver bullion held in trust for its shareholders. This ETF is merely a passage.”
One last topic that falls within the fake news category before moving on to today’s gold technical analysis. I opined about the uselessness of the gold-to-silver ratio as a predictor of price trends in my Jan. 15 article “The Golden Cross Returns in Gold“. It was great to hear another seasoned analyst drive home the same point in the following interview:
Expert Is “Uber Bullish” On Silver, Here’s Why – Lobo Tigree w/Daniela Cambone at Kitco News, Mar. 11

To view a larger version of any chart, right-click on it and choose your “view image” option.
During the U.S. government shutdown from Dec. 22, 2018 until Jan. 25, 2019, the CFTC was out to lunch with no Commitments of Traders Report (CoT) updates and a long delay in publishing backdated reports. The CoT is now current as of last week and worthy of perusing vs. the gold price. Here is the OTC gold spot weekly chart as of the Mar. 8 close, overlaid with the Mar. 5 CoT report. I recall several analysts suggesting that the commercials (bullion banks) flipping to net-long and large speculators (hedge funds) flipping to net-short from Aug. thru Oct. 2018 were not indicative of a potential spike in the gold price. I discussed the position flipping within several gold analyses articles and emphasized it during an Oct. 7, 2018 interview on Dr. Dave Janda’s Operation Freedom radio show.

Gold weekly chart as of Mar. 12, 2019…

Excerpt from the weekly gold chart analysis as of Feb. 7…
“I remain bullish near-term unless the lower trendline that marks the Ascending Scallop’s rise is decisively breached to the downside.”
An Ascending Triangle pattern drawn back to the 2016 high and low dominates the big picture on the weekly. Following the $1,326.28 high in early Feb. 2019, the gold price stopped dead in its tracks due to the overhead 500 Simple Moving Average (SMA) and lateral resistance from the price chop in early 2018. The price eventually pierced the overhead 500 SMA and 78.6% Fibonacci level over the next two weeks and put in a high of $1,346.75. The weekly candle at that high closed as a bearish Plunger Candle where the price did not close above the 500 SMA. The lower trendline (red) that marked the Ascending Scallops rise was breached to the downside two weeks later. The price is beginning to retrace its loss while riding the backside of the lower trendline, and it’s challenging $1,300 and above this evening as I type this analysis. The 50/200 SMA Golden Cross remains intact since Dec. 2016, and all of the moving averages are realigning back to a bullish lineup. Take note of how forceful the 21 SMA is trending upward through all of the moving averages.
Excerpt from the gold daily chart analysis as of Feb. 20…
“I remain bullish near-term unless the 21 Exponential Moving Average (EMA) or lower trendline is violated, and even then, the 50 EMA is not far off and would likely provide good support. The current price action may be setting up for another Throwback pattern before attempting further gains” – TraderStef
Gold 4-hour chart as of Mar. 6, 3pm EST…

Gold 4-hour chart as of Mar. 8, 9:25am EST…

Gold daily chart as of Mar. 12, 2019…

Excerpt from the gold daily chart analysis as of Mar. 1…
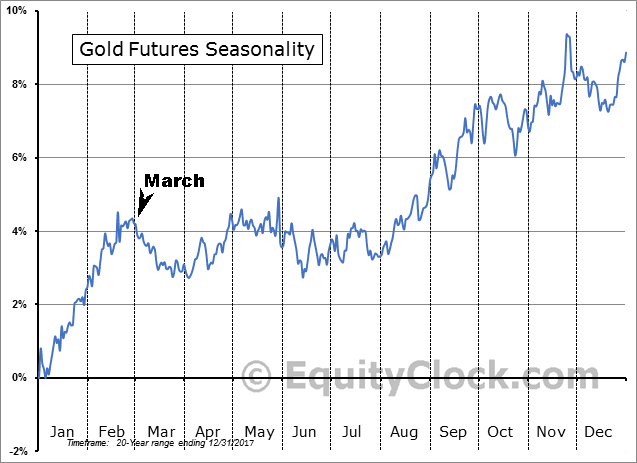
“As suspected, following the stellar $200 upside run with three sweet spot opportunities to trade since Aug. 2018, a healthy correction is in the process of finding a base. The 21 EMA was breached to the downside on Feb. 28, and a lower trendline provided initial support. On Mar. 1, that trendline was breached as automated stop-loss positions were triggered and the price found support around the 50 EMA and SMA, a secondary lower trendline, and the $1,287 Fibonacci level that slices through the lateral price chop that occurred through Jan. 2019. The DMI-ADX has flipped to a negative stance, and the StochRSI plunged to an oversold condition on Mar. 1. The volumes were rising as the price fell during the last three trading sessions, and they have reached a peak or are fuel for further downside price action. The next support level is at the 100 EMA and $1,275 Fibonacci. The overhead 50 EMA must be taken out with conviction for an upside pivot to have any legs, otherwise the price will probe the next support level and/or chop sideways. March generally leans to the downside before chopping sideways when considering the seasonality pattern. I remain bullish long-term but revert to a neutral stance until the uptrend reasserts itself above the 50 EMA and $1,300 with conviction.”
Note that where the weekly printed a Plunger Candle, a bearish Evening Doji Star printed on the daily. The pullback in price came very close to tapping the 100 EMA, but it found support at around $1,280 with several opens and closes at $1,287 on the 61.8% Fibonacci level drawn from the 2018 high and low. There were two candlestick patterns where the price found support that indicated a reversal in price was possibly in the cards. The first was a Southern Doji, and the second extended out along the Fibonacci line as a Bullish Tri Star. On the following day, a pathetic February jobs report hit the headlines showing only 20k created, which spiked the price of gold back above the 50 EMA. The overhead 21 EMA is the last overhead moving average sitting at $1,304, with a convergence of trendlines drawn down from the recent high and up from recent lows. The price is breaking above them all as I type this. The DMI-ADX remains in a negative crossover, but the StochRSI has crossed back into bullish momentum that will likely push the DMI-ADX back into a positive stance. The 50/200 EMA Golden Cross that occurred in early Jan. 2019 remains intact while all the moving averages continue to line up for an upward trend in price. I remain bullish long-term and will switch to bullish near-term if tomorrow’s candle and volume confirm an uptrend has resumed, otherwise I will stay neutral until the price action exhibits conviction. The price has a good deal of lateral resistance levels to deal with beyond $1,350 that originate from the price chop during the highs in early 2018.
ECT Scene – “One Flew Over the Cuckoo’s Nest” (1975)
Plan Your Trade, Trade Your Plan
TraderStef on Twitter
Website: https://traderstef.wordpress.com