Gold has staged a rally back to the $1,250 level following the prolonged 2018 downtrend, and it may continue upward and take out resistance through the end of this year and 2019. My two most recent articles with technical analyses on gold are “The Wither of November”, and a “Gold Sweetspot Alert Update”. Gold’s status as a hedge in volatile markets makes it worth keeping an eye on.
The mining industry is undergoing a tectonic shift while continuing to cut costs. The majors are busy with mergers and acquisitions to consolidate resources, lower their costs after a high-grading binge, and increase proven reserves by acquiring existing mines with successful exploration programs in a peak gold world.
We Have Definitely Hit Peak Gold Production; Numbers Prove It – Cal Everett, CEO of Liberty Gold, Nov. 2018
____________

____________
Major Miners Are Hungry For Junior Acquisitions – Steve Todoruk at the Precious Metals Summit in Beaver Creek, Sep. 2018
Analysts Totally Wrong About Gold: Top Gold Miners Production Cost Still Provides A Floor In The Market Price – SRSrocco Report, Nov. 2018

The miners continue to suffer in price performance, even after the initial rally that coincided with gold’s bottom in Dec. 2015. There are a few mining stocks on the scanner that look interesting but do not have an improving chart pattern and ample liquidity. I have chosen Barrick Gold and the major Gold Miners ETF GDX for your consideration today. To view a larger version of any chart, right-click on it and choose your “view image” option.
ABX – Barrick Gold daily chart, Dec. 10, 2018 close…
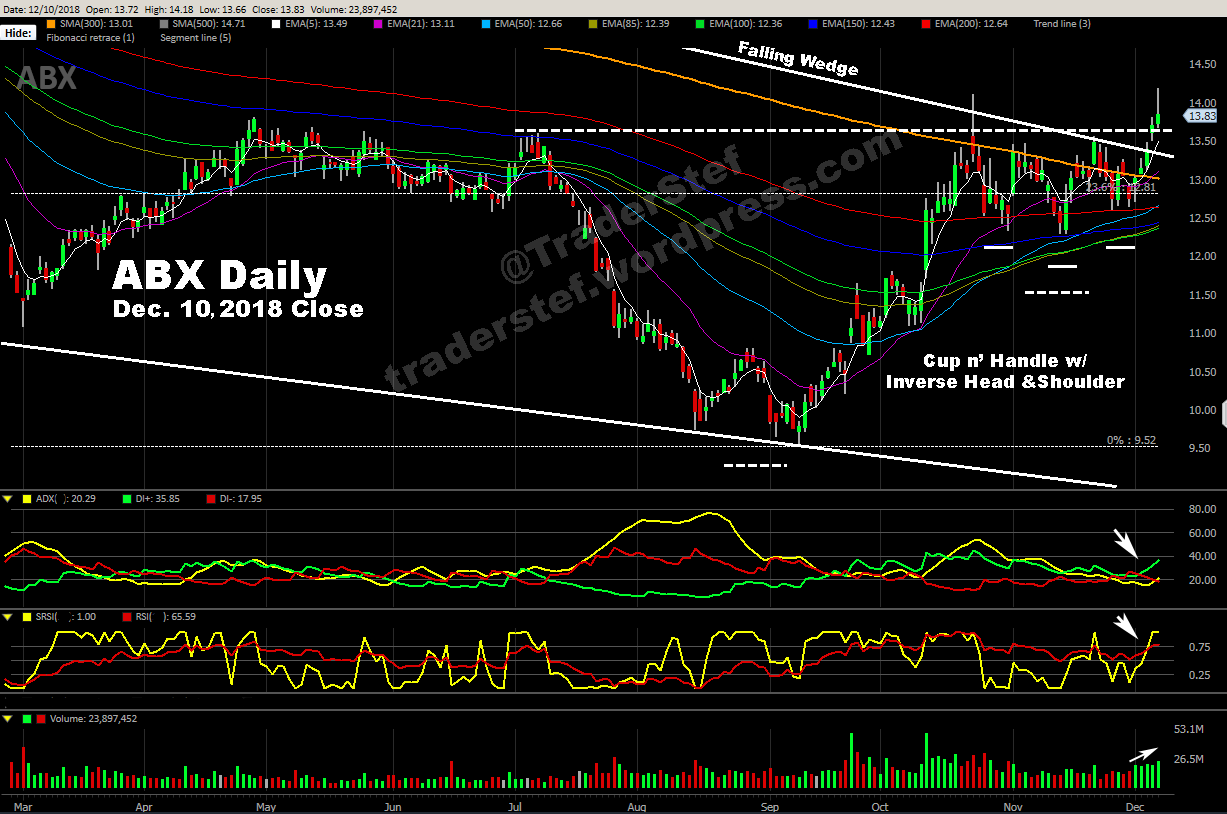
ABX is one of the strongest gold mining stocks right now and holds the 2nd-place slot in the GDX basket of miners as of Nov. 30, with a 9.42% allocation (see chart below). Its stock price rallied higher on strong volume beginning in early September and managed to make a series of higher highs until the wither of November set in. It has performed very well while facing extreme stock market volatility. A key resistance level at $13.50 was challenged throughout November and formed the neckline of an Inverse Head & Shoulders pattern within the handle of a Cup ‘n Handle drawn back to July 2018. The price gapped up last Friday at the open and decisively breached the topside trendline of a Falling Wedge (see the weekly chart below), the Cup ‘n Handle rimline, the Inverse Head & Shoulders neckline, and closed at $13.68. The price followed through today with a $14.18 high and $13.84 at the close. The studies are bullish, with all the Exponential Moving Averages (EMA) lining up below the price rise. The DMI-ADX is setting up a classic Alligator Tongue with positive momentum, the StochRSI is breaking out topside, and buy volumes are rising along with the price.
ABX weekly chart, Dec. 10, 2018 close…

On the weekly chart, you can clearly see the Falling Wedge with a Cup ‘n Handle at the tail end and a break above the topside trendline. The next significant level of resistance is the confluence of a Fibonacci level and the 200 EMA (red line). The DMI-ADX is flat right now but remains positive, and the StochRSI has been hanging out topside for a month, which may indicate that a pullback in price is likely when the 200 EMA is challenged. The Momentum (MOM) and Commodity Channel Index (CCI) studies remain positive with rising lines. The volumes have fallen off since the September rally, but this week’s volume bar remains TBD until the close on Friday.
ABX monthly chart, Dec. 10, 2018 close…
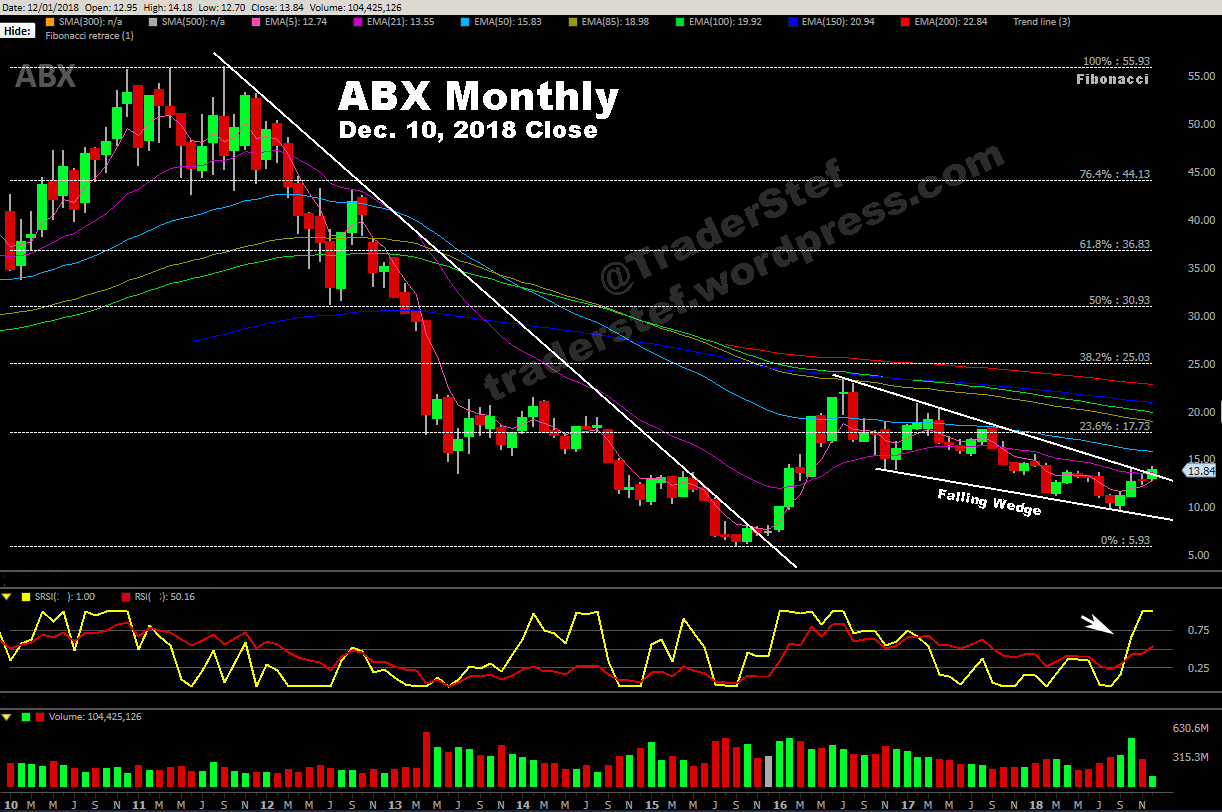
The monthly chart provides a much broader view back to the 2011 highs. The StochRSI is giving a bullish signal, but we cannot judge the underlying volume until the end of the month. The 21 EMA and 50 EMA must be taken out with conviction in price and volume for a sustained rally to manifest.
GDX VanEck Vectors top 10: see the full list of stocks in the basket as of Nov. 30, 2018.

GDX daily chart Dec. 10, 2018 close…

The double Inverse Head & Shoulders pattern built off the August low is an interesting development that indicates steady accumulation. The price breached the neckline of the second Inverse Head & Shoulders last Friday and tapped the overhead 200 EMA today with a high of $20.55 and a close at $20.13. The price is now within striking distance of the topside trendline of a Falling Wedge (see monthly chart below) drawn back to 2016. That trendline must be taken out with conviction in order for a rally to challenge lateral resistance at $23. The DMI-ADX study is setting up a classic Alligator Tongue with positive momentum just like ABX, and the StochRSI is breaking out topside with healthy volume on the buy side.
GDX monthly chart Dec. 10, 2018 close…

The monthly chart provides a much broader view back to the 2011 highs. The Falling Wedge is clearly visible. The StochRSI is attempting to break out topside, but we cannot judge the underlying volume until the end of the month.
Neil Young – Old Man & Heart Of Gold (1971)
Plan Your Trade, Trade Your Plan
TraderStef on Twitter
Website: https://traderstef.wordpress.com
____________
____________
