In early December, everyone wondered if the U.S. stock market plunged into a bear market, so I published “Is the Stock Market Plunge a Fork in the 10-year Pig Party?.” I appeared on live talk radio on Dec. 9 with Dr. Dave Janda’s Operation Freedom, where I urged the passive investor and trader to consider taking profits off the table. As of Friday, Dec. 21, the bull market pig looks to be forked and roasting over an open fire as the financial media pundits sigh over the loss of their ten-year relationship with Goldilocks.
Today’s installment is a technical analysis update on the markets using the SPDR $SPY ETF instead of the S&P 500 index and the $DIA SPDR ETF instead of the Dow index. Before diving into the charts, the following items are worthy of a mention:
- Yellen Flipped to a Financial Crisis Trigger in Your Lifetime (Corporate Debt) – TraderStef, Dec. 13
- Dow dives to end its worst week in 10 years – CNBC, Dec. 21
- Loan Market Is Freezing: Banks Fail To Sell $1.6bln In Loans – Zerohedge, Dec. 22
- Global Outlook – IceCap Asset Mgmt., Dec. 2018…
“To be clear – there’s now an entire generation of investment professionals around the world who’s entire career (both professional and academic) has occurred during a period dominated by:
- 0% interest rates
- negative% interest rates
- QE and money printing
- bank bailouts
- and sovereign debt bailouts…
When markets are charging dead ahead into an all-certain event, the investing public looks for leaders. It looks for dynamic wisdom. It looks for 5-dimensional thinking. Instead, the industry is increasingly being lead by fearless leaders who’ve earned exactly zero stripes, no investment scars, and who are not compensated to see the investment world for what it is – a complex, interconnected relationship between and amongst multiple factors which always move in sync (positive and negative correlations) during significant turning point. Yes, equity markets continue to soak up every minute on headline news media. Yet, the global bond market continues its relentless march toward a certain, spectacular event… Clearly knowing they are now in the cross-fire of the regulators, Moody’s is on point with their warning of potential defaults in one of the “searching for yield’s” favorite market – the High Yield Bond sector. Which of course is also known as the Junk Bond sector.”
Jeremy Siegel of the Wharton School says that the Fed is behind the curve by raising interest rates a fourth time in 2018. “This isn’t good.”
Let us move on to the charts. I will include the Dec. 6 index charts and analyses for reference. To view a larger version of any chart, right-click on it and choose your “view image” option.
Dow weekly chart as of Dec. 6, 2018 close…

“Two potential patterns have surfaced on the Dow. There is a Bearish Wolfe Wave within the upper and lower blue trendlines. If the lower trendline is breached to the downside, the Wolfe Wave confirms. A Double Top has also taken shape within a 3% price range, which includes the 26,698 January high and 26,960 September high marked with an Evening Doji Star candlestick. The Double Top confirms if the valley low at 23,112 is breached decisively to the downside. The 23.6% Fibonacci drawn from the 2015 low is providing support, but the 50 Simple Moving Average (SMA) has been breached to the downside multiple times since October. The StochRSI remains in a negative momentum pattern and the DMI-ADX is negative but indecisive. One study keeping the Dow out of a full-blown bear market is the trendline drawn up from the February 2016 low that has not been touched. This weeks low is only 1,500 points away from the 2016 trendline and we have already had weekly swings of that magnitude since February. A decisive breach of the 100 EMA, the Double Top valley low, or the 2016 trendline may lead to a major plunge.”
Dow SPDR $DIA ETF daily chart as of Dec. 21, 2018 close…
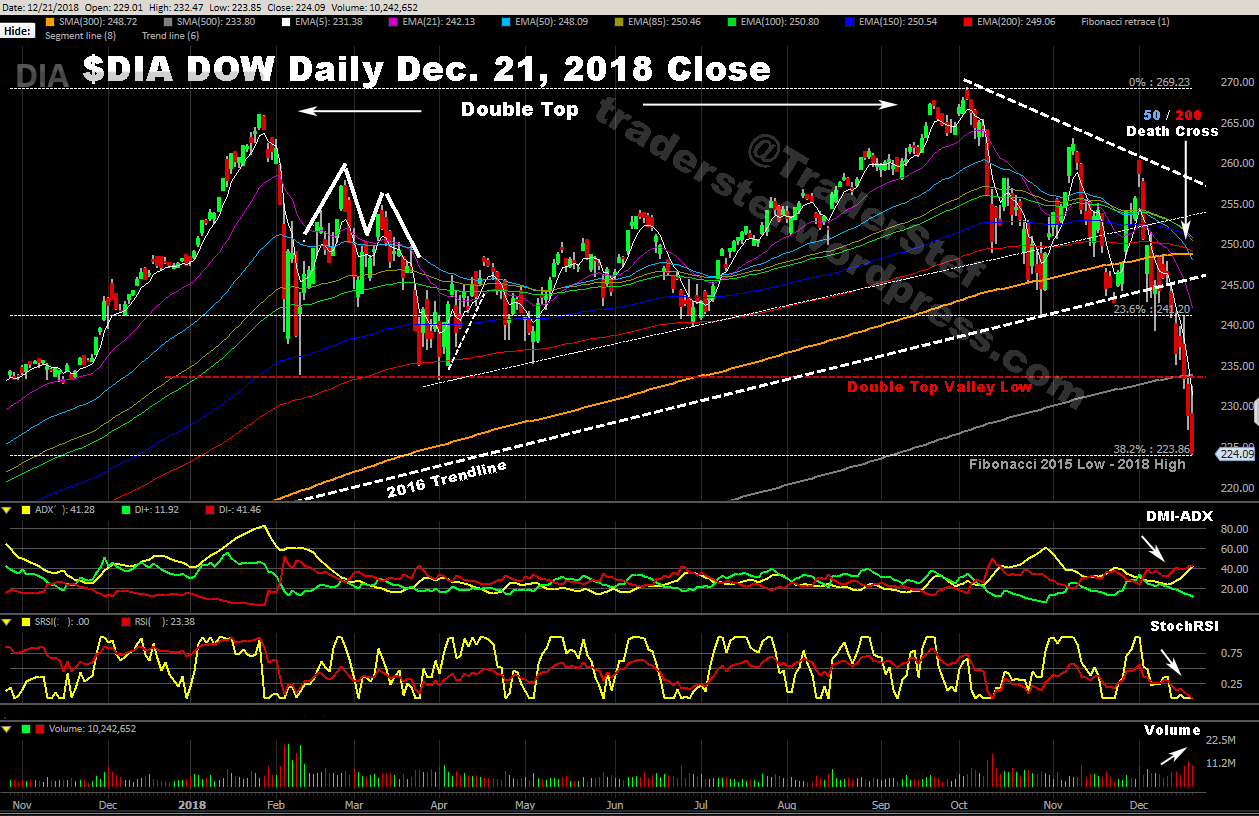
The Bearish Wolf Wave and Double Top patterns confirmed this past week following a decisive plunge through the valley low and the 2016 and 2018 lower trendlines. The Falling Knife of the price held the 38.2% Fibonacci level drawn up from the 2015 low to the 2018 high. The 50 & 200 Exponential Moving Averages (EMAs) crossed to the downside, and that triggers an ominous Death Cross signal. The DMI-ADX has formed a negative momentum Alligator Tongue, the StochRSI bottomed out with no sign of resurgence, and the volumes are rising along with the falling price. Everything on this daily chart is bearish.
Dow $DIA ETF monthly chart as of Dec. 21, 2018 close…

The monthly does not add any bullish hope to the bearish daily. After the price plunged through the double top valley low and trendlilne, it is resting just above the $220 23.6% Fibonacci level drawn up from the 2009 low to the 2018 high. There are no significant buy volumes/candlesticks between the current price and the 50 SMA and $191 at the 38.2% Fibonacci level. The 38.2% is perched just above a broad lateral support area of price chop during 2015 at $180-$190 and the 2009 trendline creates a potential confluence of support. The DMI-ADX, StochRSI, CCI, and Momentum studies are all negative. The monthly chart is bearish near- and long-term as the price has a high risk of falling quickly to the 2015 lateral support level.

S&P 500 weekly chart as of Dec. 6, 2018 close…

“Unlike the Dow, the S&P 500 is already kissing the 2016 lower trendline. There is no Double Top here because the January and September highs are beyond a 3% price spread, but a bearish Rectangle Bottom has taken shape. The 21 SMA is acting as resistance on every price surge to the upside, and a confluence of the 85 and 100 SMA along with multiple trendlines are providing support with the 50 SMA stuck in the middle. The StochRSI remains in a negative momentum pattern and the DMI-ADX is negative but somewhat indecisive. If the 2016 trendline and 100 SMA are breached with conviction, we could have a major plunge on our hands.”
S&P 500 SPDR $SPY ETF daily chart as of Dec. 21, 2018 close…

The bearish Rectangle Bottom pattern was confirmed this past week. The 2016 lower trendline, the February 2018 low, and the $251 38.2% Fibonacci level drawn up from the 2016 low to the 2018 high were decisively breached to the downside. The 50 & 200 EMAs crossed to the downside, and that triggers an ominous Death Cross signal. The price closed slightly above the $238 50% Fibonacci level. The DMI-ADX has formed negative momentum Alligator Tongue, the StochRSI bottomed out with no sign of resurgence, and the volumes are rising along with the falling price. Everything on this daily chart is bearish.
S&P 500 $SPY ETF monthly chart as of Dec. 21, 2018 close…

The monthly does not add any bullish hope to the bearish daily. The price closed at the $240 23.6% Fibonacci level and is only stone’s throw away from the 50 SMA at $232. The 2009 lower trendline is crossing the $220 area. The next level of solid support is the $207 38.2% Fibonacci, which sits just below the broad lateral support area of the price chop during 2015. The DMI-ADX, StochRSI, CCI, and Momentum studies are all negative. The monthly chart is bearish near- and long-term, as the price has a high risk of falling quickly to the 2015 lateral support level.
Robin Trower – Bridge Of Sighs (1974 UK Live TV – Trower is on the 6-string and not singing)
Plan Your Trade, Trade Your Plan
TraderStef on Twitter
Website: https://traderstef.wordpress.com
